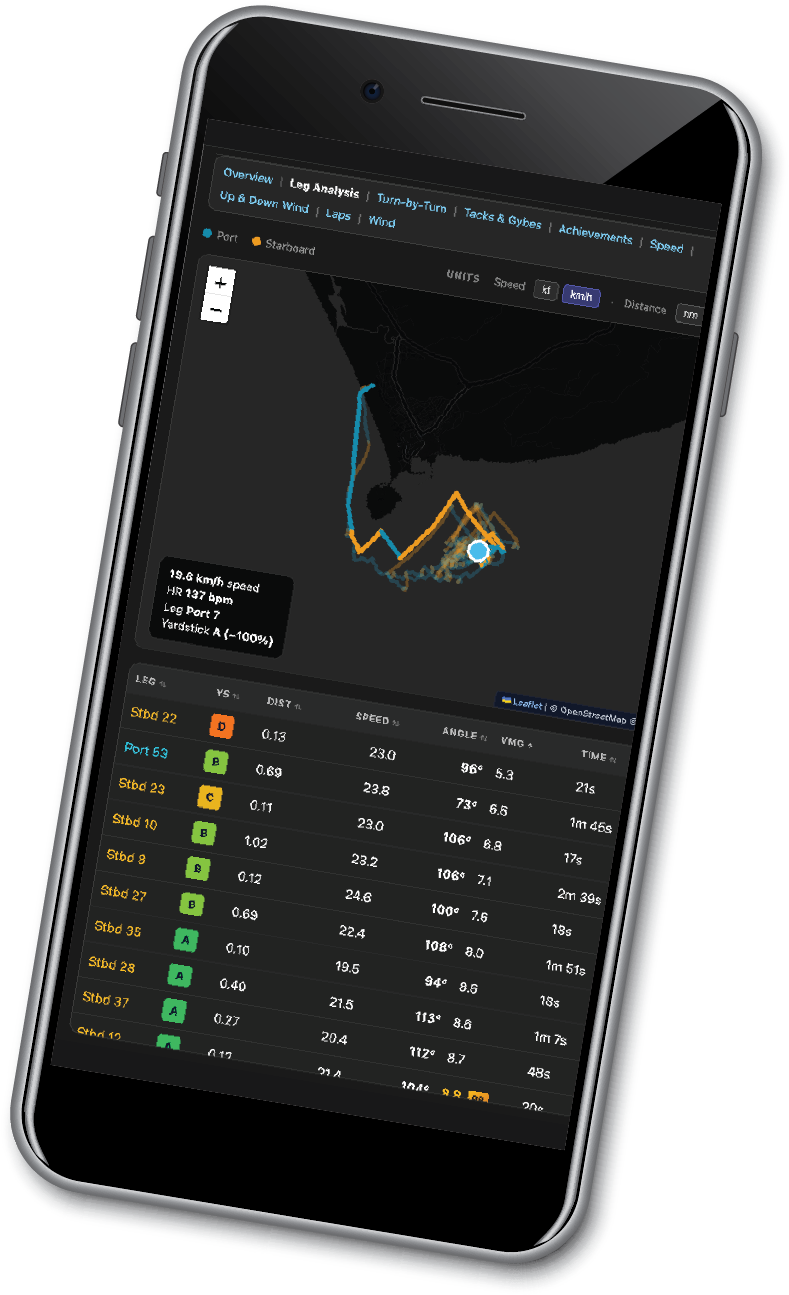
Leg analysis
Tactical legs
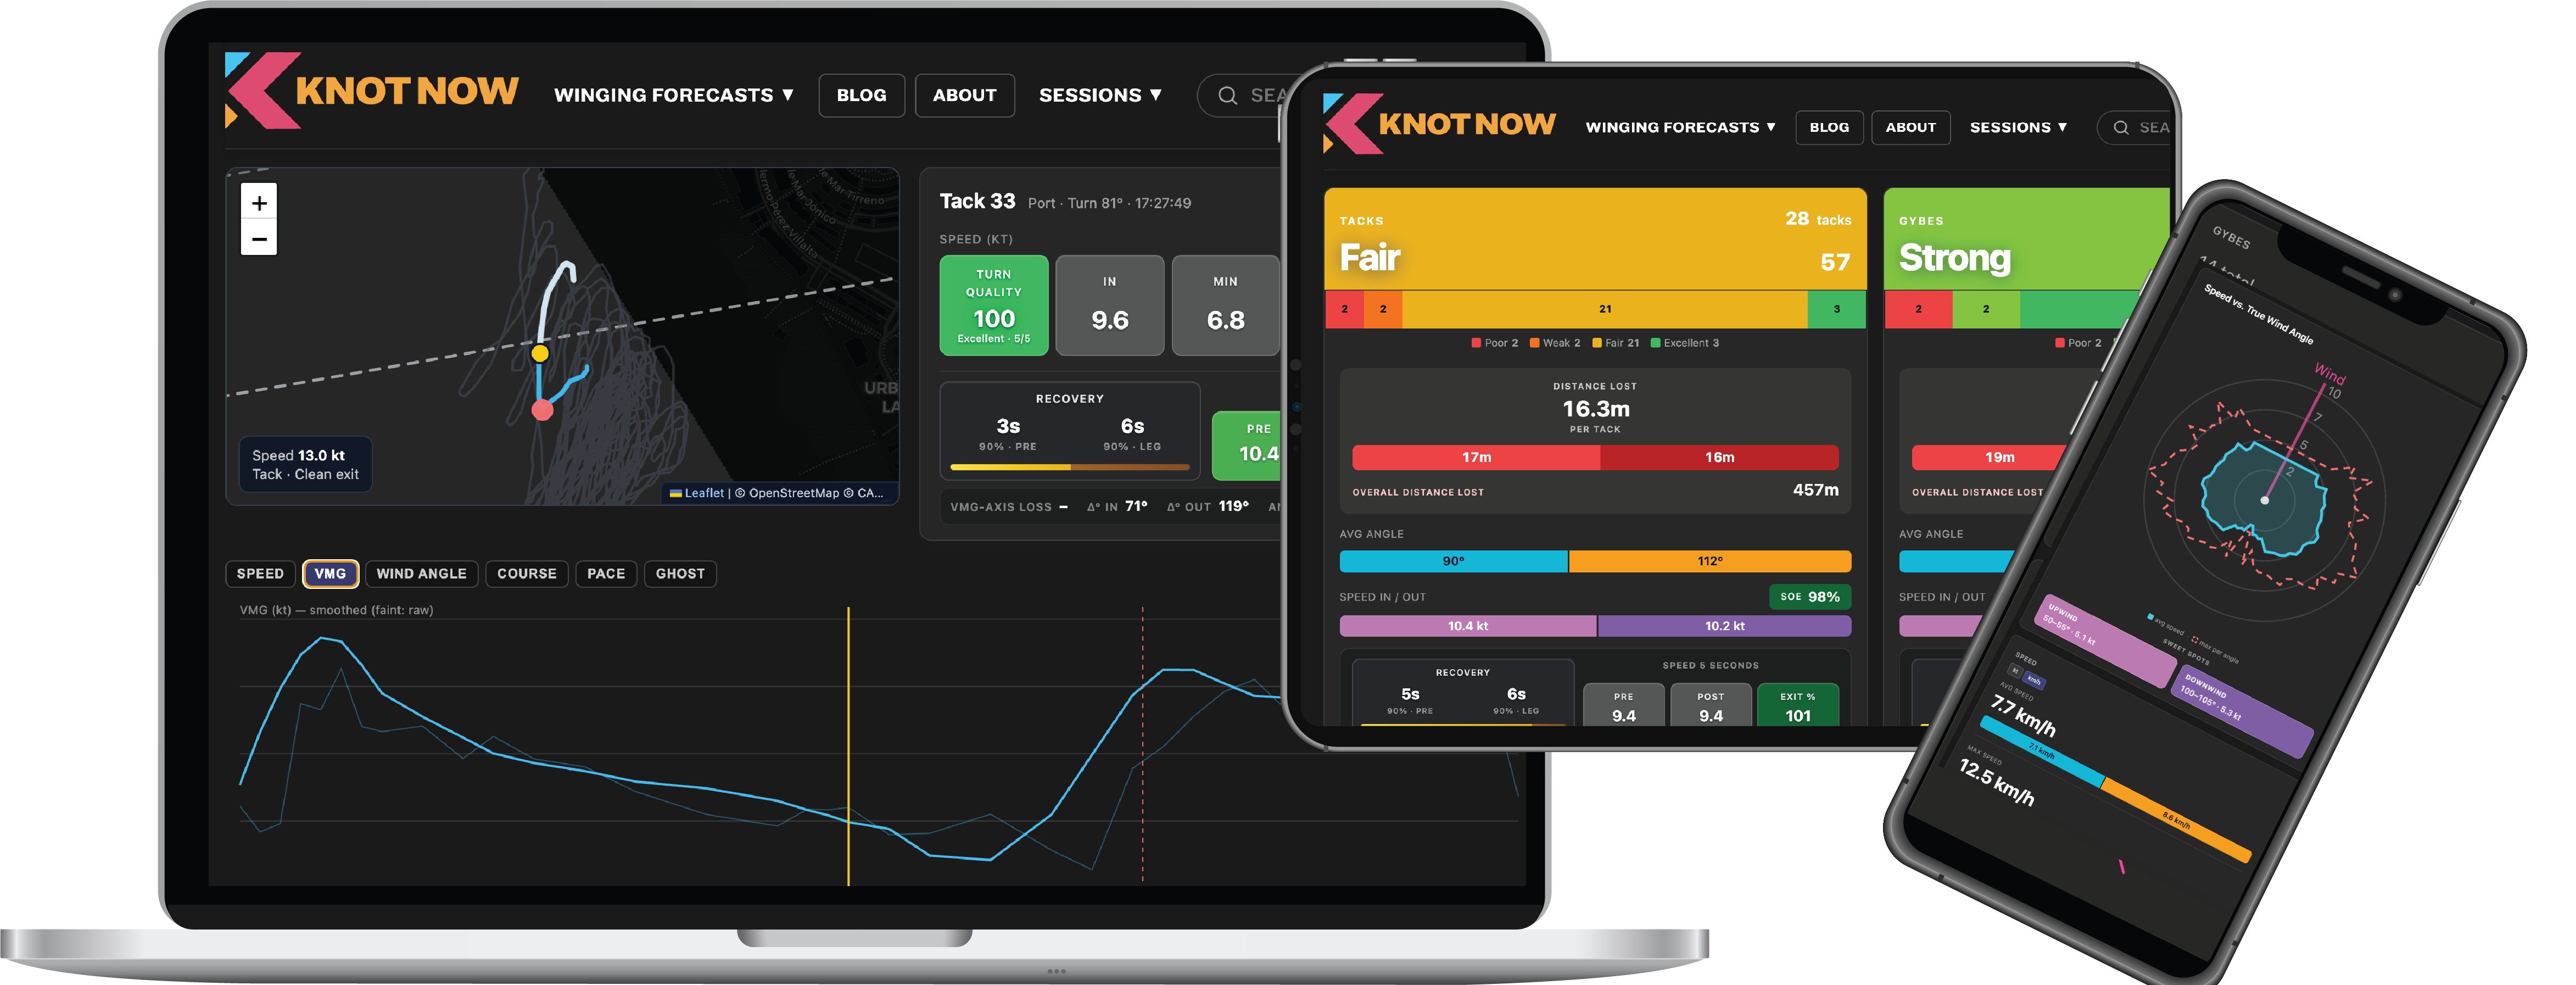
KnotNow helps you structure the session into legs - upwind beats, downwind runs, and reaches - so you can compare how you sailed each segment instead of eyeballing one average for the day.
That matters for asymmetry: many boats and boards feel faster on one tack. When port and starboard are side by side in the numbers - speed, angle, and progress - you’ll see whether it’s setup, technique, or conditions, not guesswork.
- Segmented debrief - isolate the parts of the course where small gains add up.
- Port vs starboard - spot persistent bias in speed or angle.
- Pair with notes & kit - use session notes plus your saved board, wing or sail, and foil to remember what you changed between outings.
For a tuning day, upload, review legs, adjust, and come back next time with a clearer picture of what actually moved the needle.