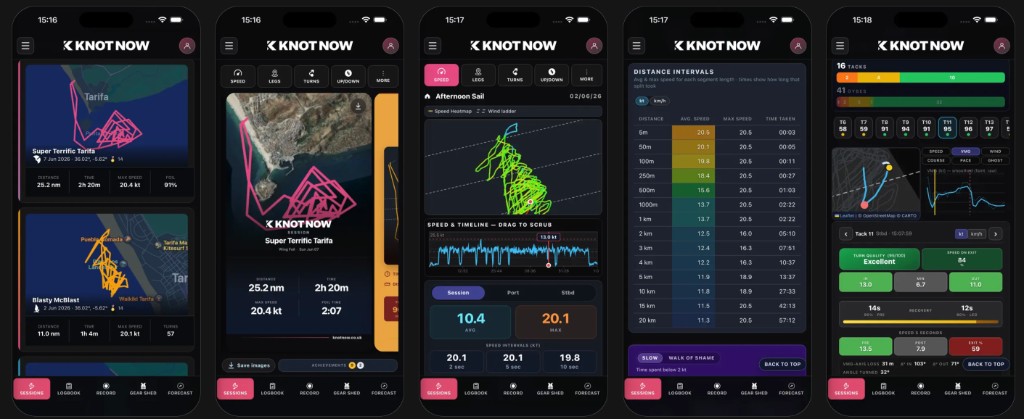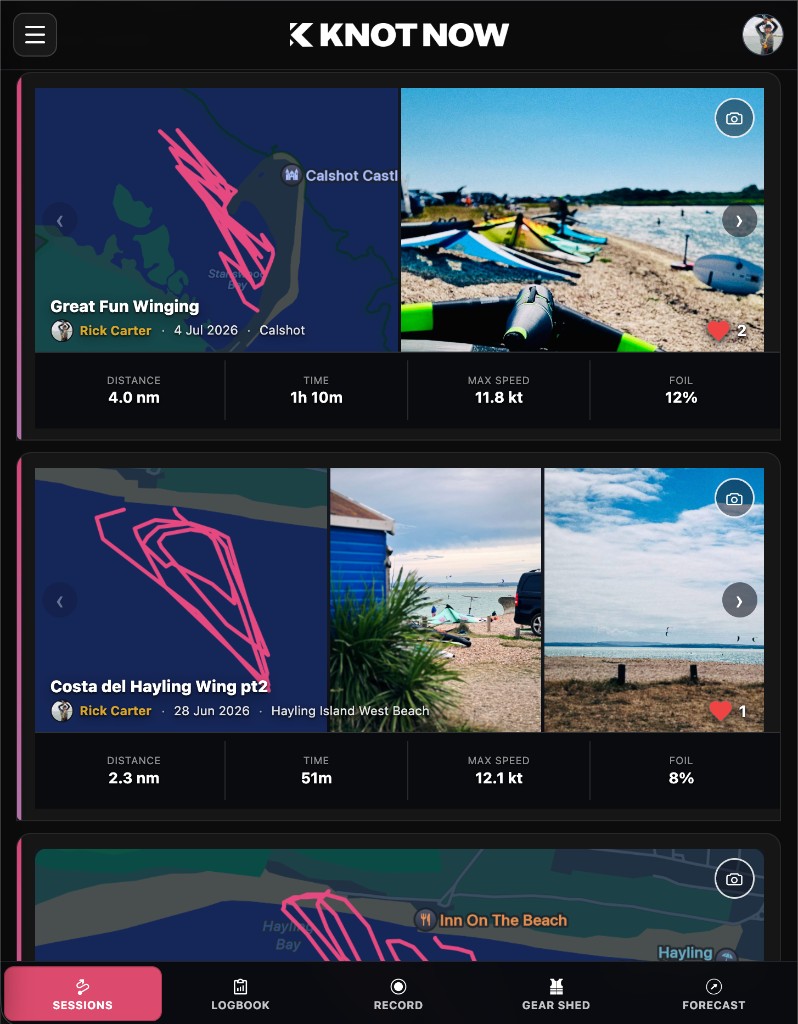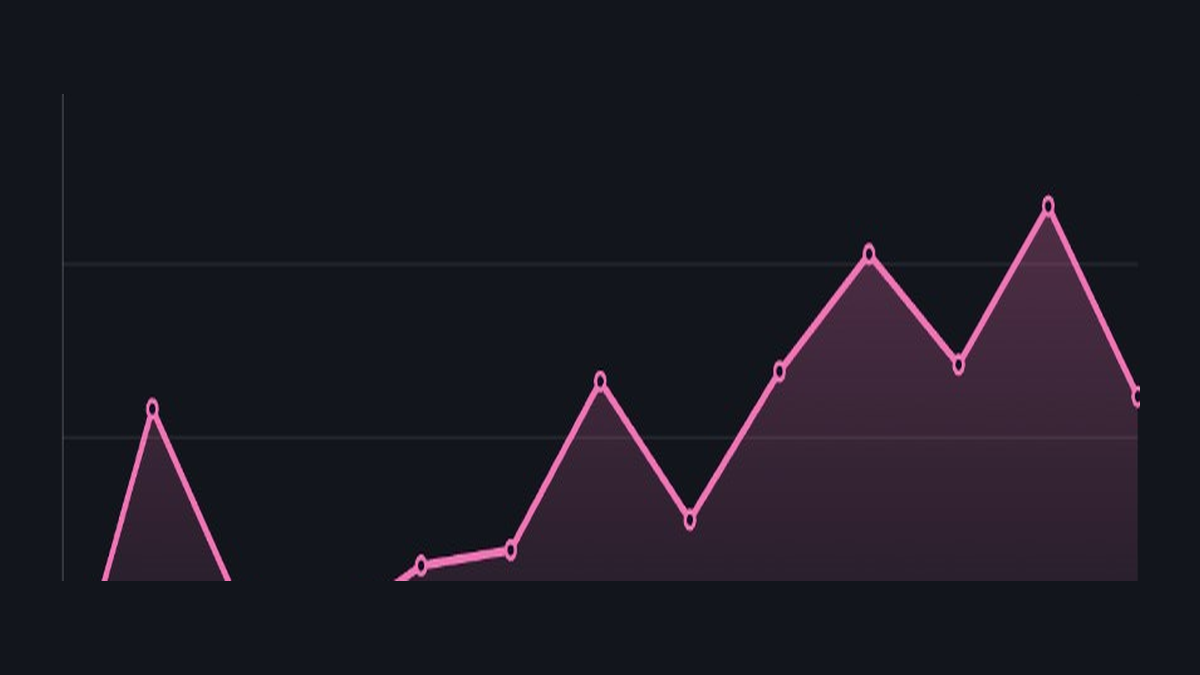
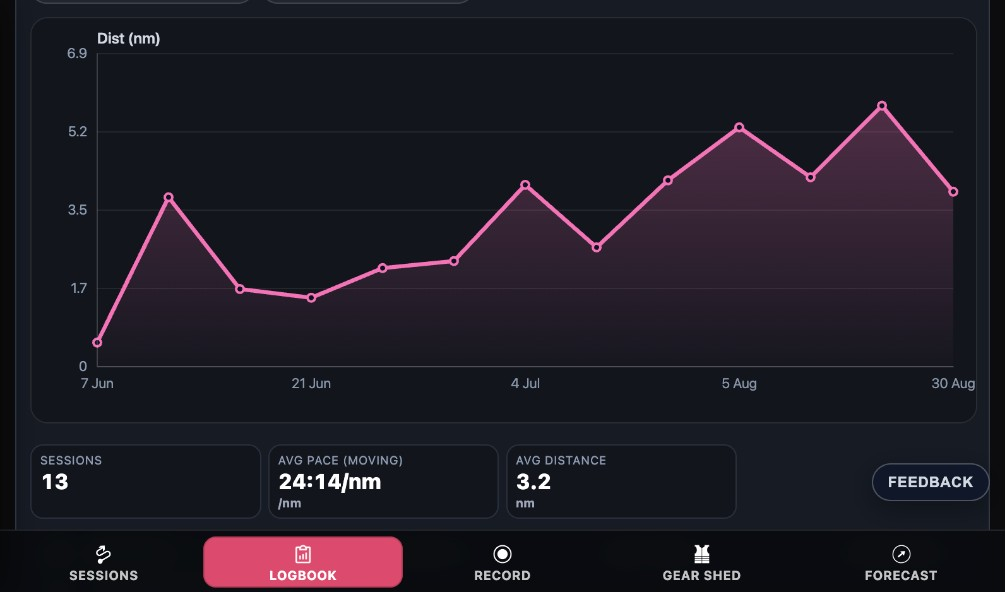
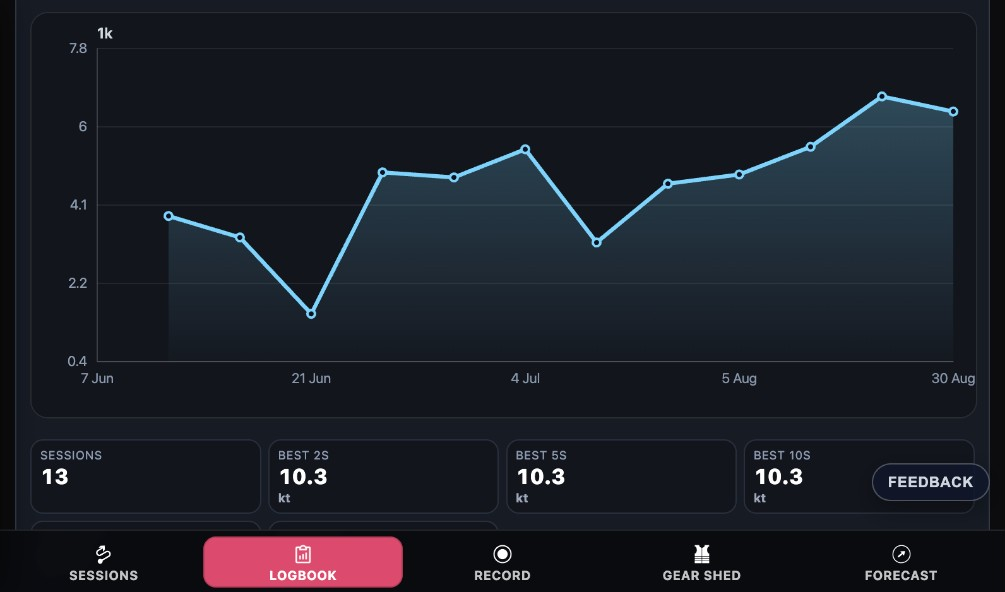
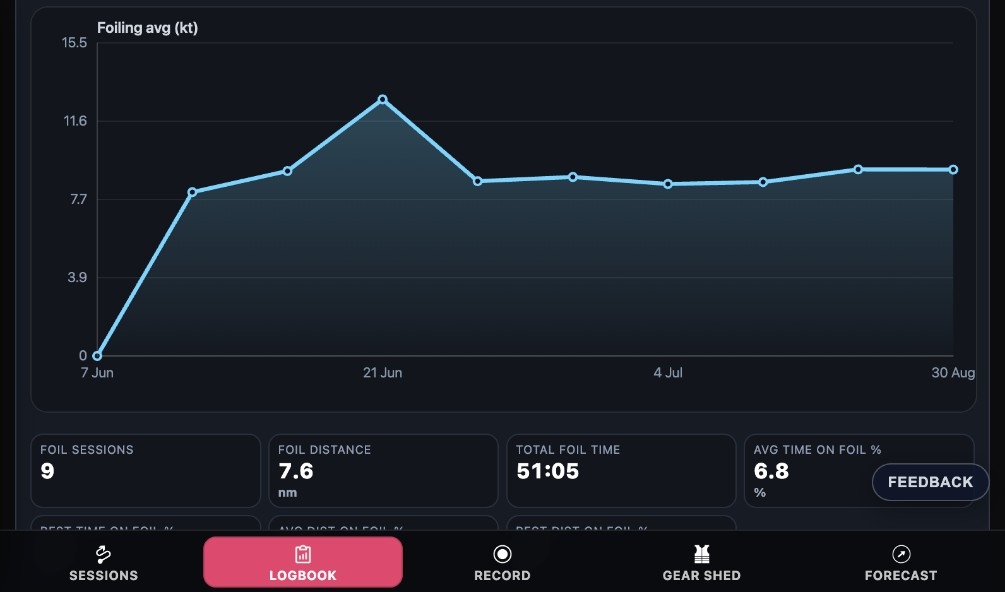
Stop guessing what made you faster. KnotNow Logbook turns raw session tracking into proper, actionable intelligence. Instead of looking at a single session in isolation, Logbook reveals the bigger picture: how your peak speeds, distance, and efficiency evolve across an entire season. Through interactive charts, clear summary cards, and granular session breakdowns, you get total visibility into your growth. Select any metric you track, spot macro trends instantly, and dig into the numbers that drive peak performance.
Pick a Metric, Unlock the Signal
Every sport demands its own focus. Whether you are dialling in foil efficiency while wing foiling, pushing top-end knot speeds on a kite, tracking tack angles in dinghy racing, or optimising distance on a windsurf run, Logbook adapts to your discipline.
Switch seamlessly between metrics: track total distance, moving pace, peak speeds across duration windows, total foil time, on-foil percentage, or crash frequencies. With a single tap on a metric chip, your chart, summary metric cards, and lower session tables automatically sync to display pinpoint data for that exact metric.
Isolate Gear Impact with Precise Segmentation
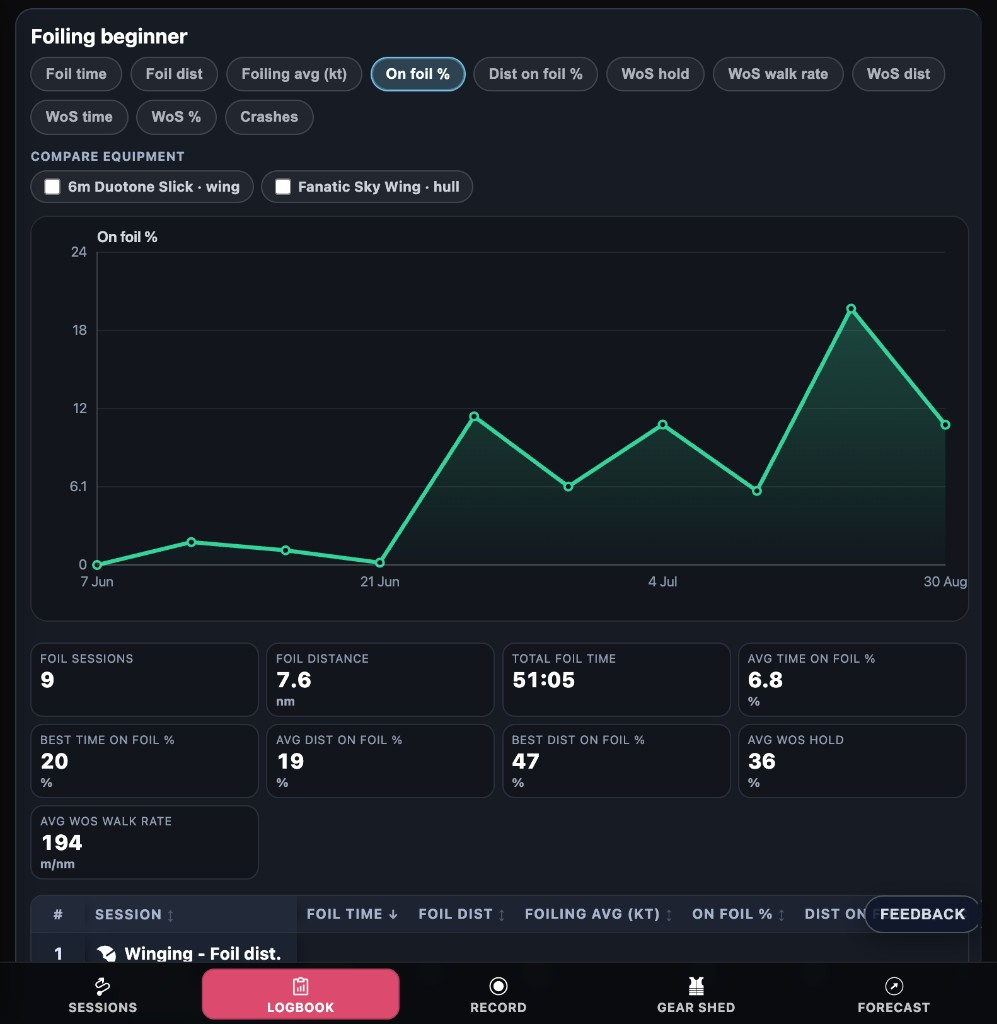
The secret to consistent gains isn’t just riding harder — it’s riding smarter. Logbook’s segmentation engine lets you slice your data by equipment or session tags to isolate variables with complete precision.
Compare a specific wing, board, or sail against the rest of your historical log. Validate whether a subtle tuning tweak — a longer mast, a smaller front wing, adjusted shim angles, or custom strap placements — actually moved the needle. Instantly measure the real impact of equipment changes on your time on foil, top-end speed, VMG, or stability. Know with certainty what gear combination delivers maximum performance in specific water conditions.
From High-Level Trends to Granular Diagnostics
Directly beneath your performance graphs, Logbook compiles your overall totals and seasonal averages, offering an immediate health-check of your overall progression. Right below the summary cards sits the complete session table, giving you direct access to the individual rides responsible for your trends. Click into any outlier session to analyse GPS tracks, environmental conditions, and specific run metrics. Track your past, analyse your present, and optimise every future session on the water.
Open your logbook
In the app: Logbook tab. Download KnotNow →
Already signed in on the web? Open Logbook