KnotNow was born from a simple obsession: a love for being on, or in the water. As a keen wing foiler, dinghy sailor, surfer, and SUP’er, nothing beats that feeling of coming ashore when everyone is buzzing about the conditions, completely stoked after a great session.
But as water sports lovers, we face two major frustrations. First, the pre-session headache: constantly checking multiple apps just to piece together a generic forecast, all while worrying about what’s being discharged into the water. Second, the post-session letdown: being stuck with rubbish tracking options that offer little insight into how we performed.
I decided it was time to build something better.
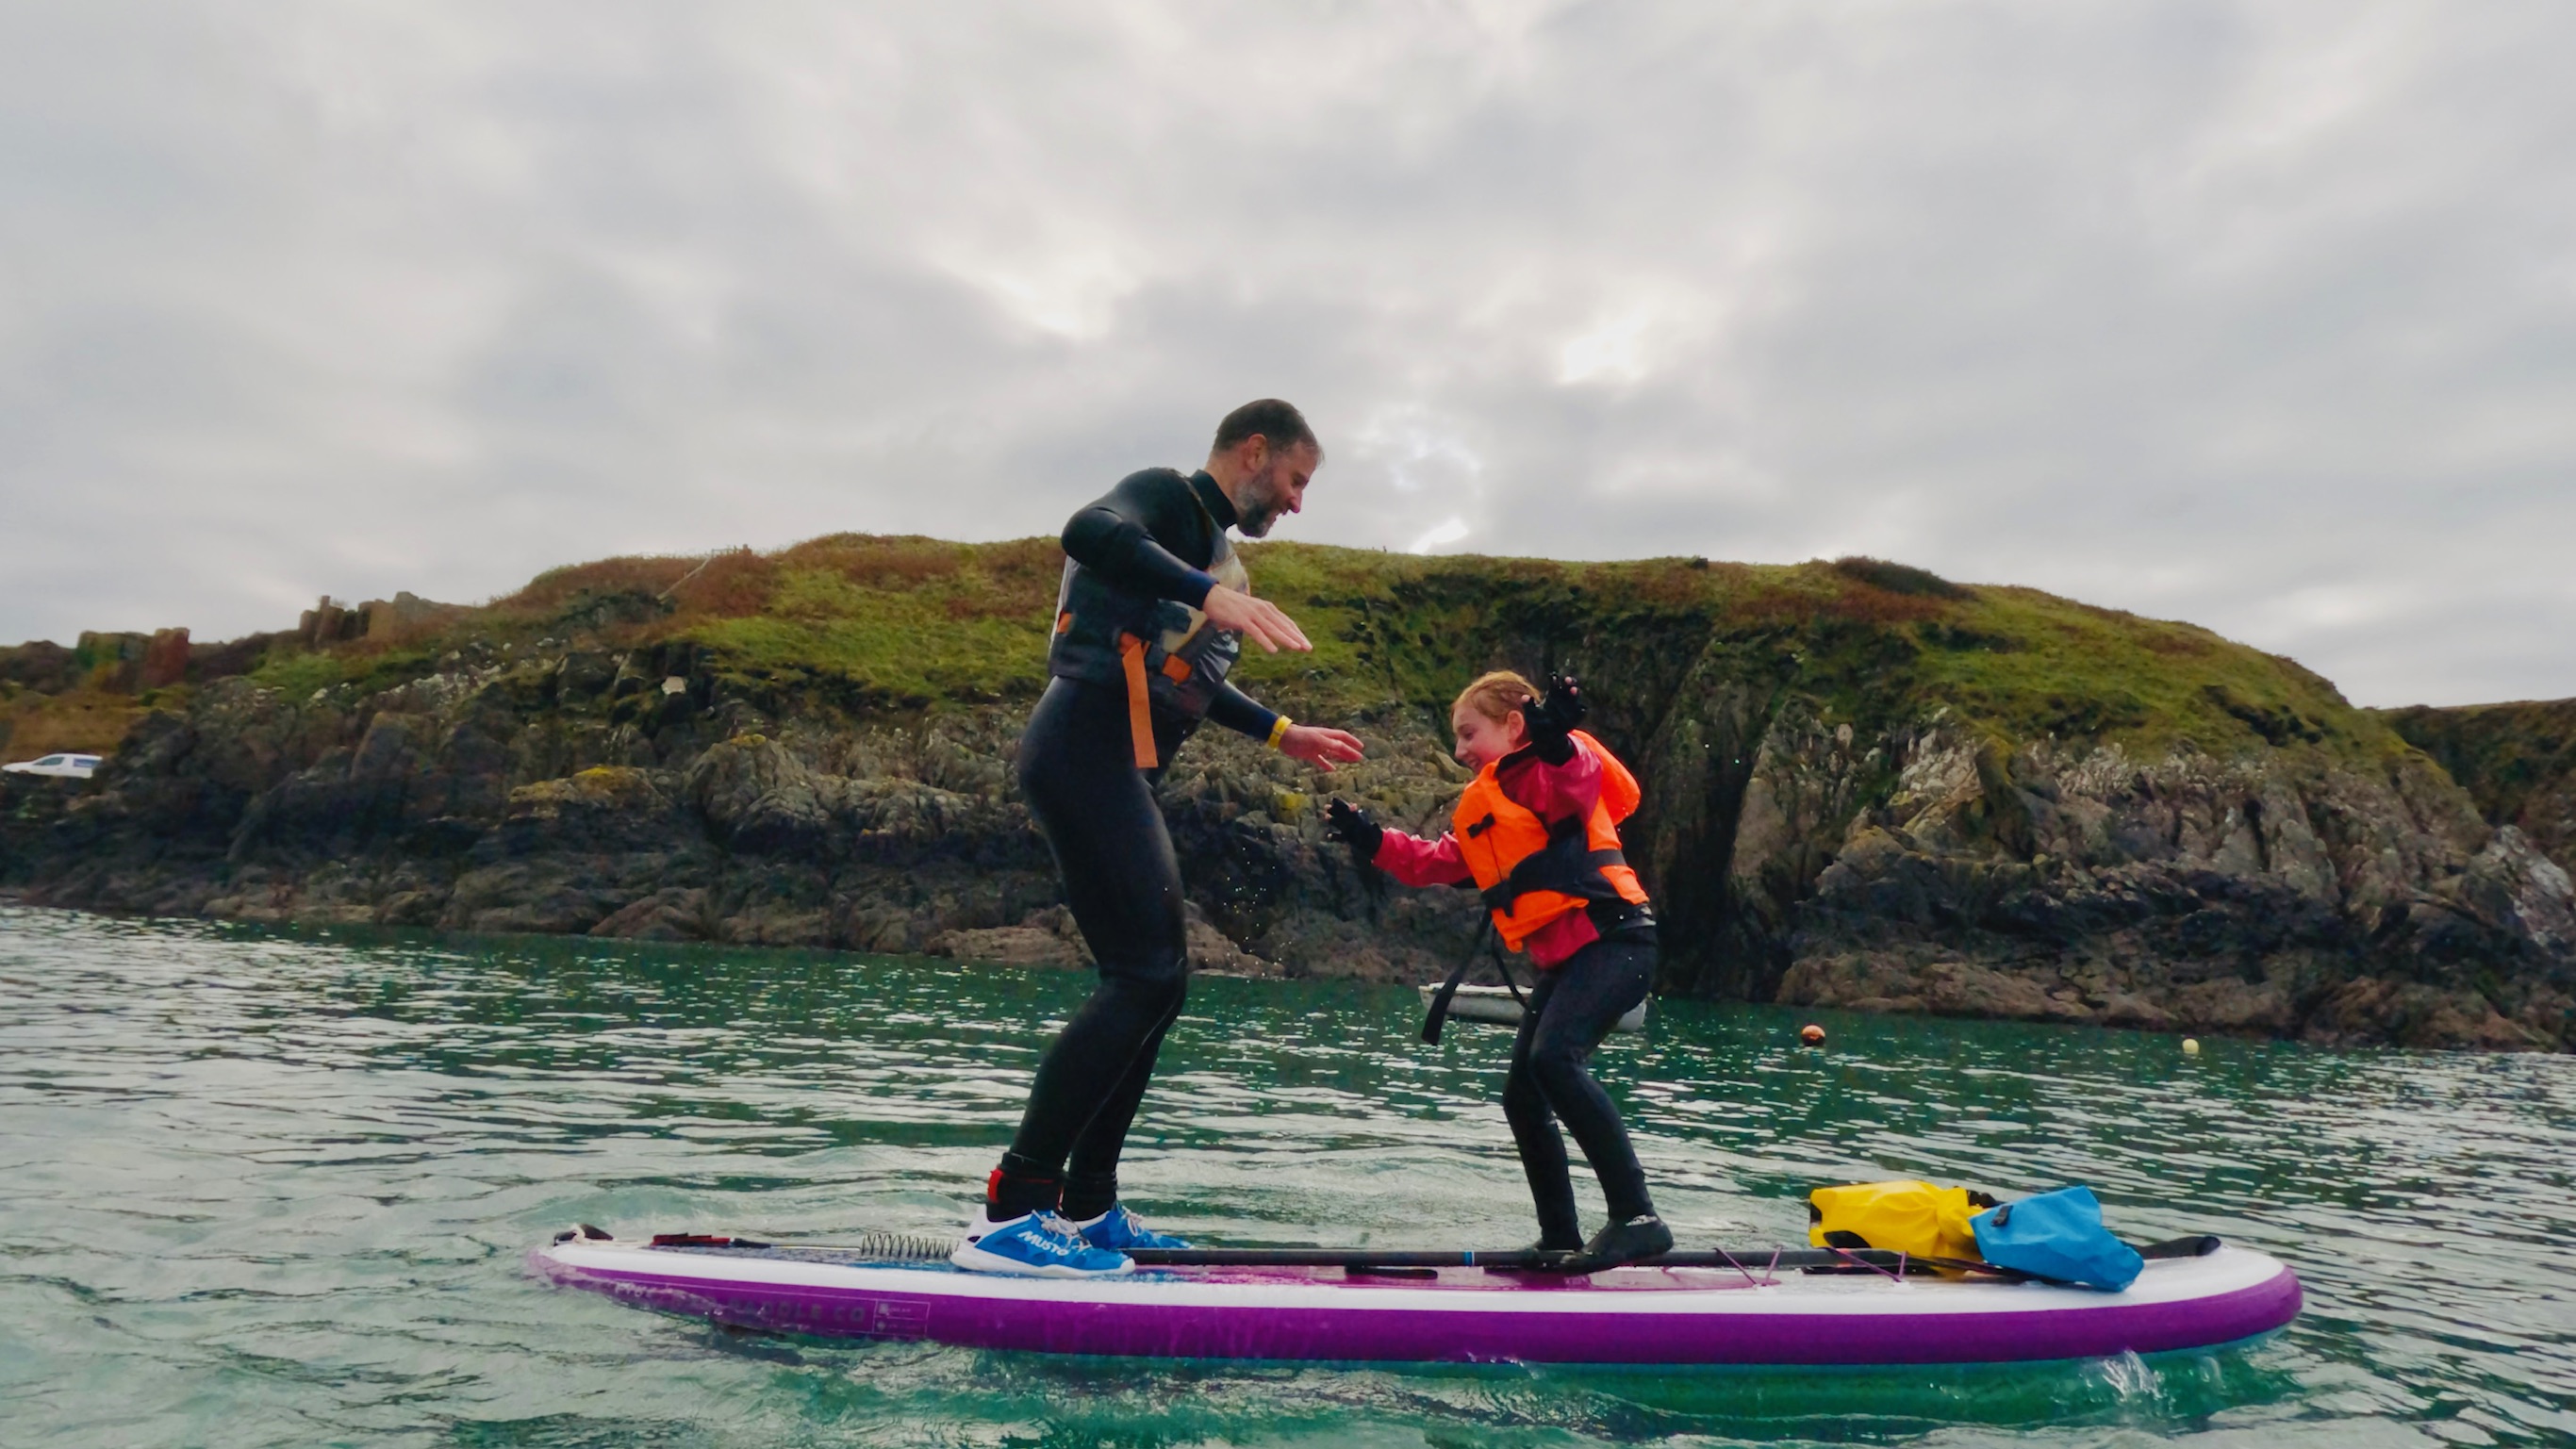
From Data Analytics to the Ocean
Before building KnotNow, I spent 25 years working in marketing and data analytics. I am a keen cyclist and a longtime user of Strava. When I looked at the water sports world, it felt like we were being left behind. There was no intuitive way to analyse a session, visualise progress, or gain the kind of insights that runners and cyclists take for granted.
So, I combined my professional background with my passion for the water to build the ultimate tracking and forecasting tool.
What Sets KnotNow Apart
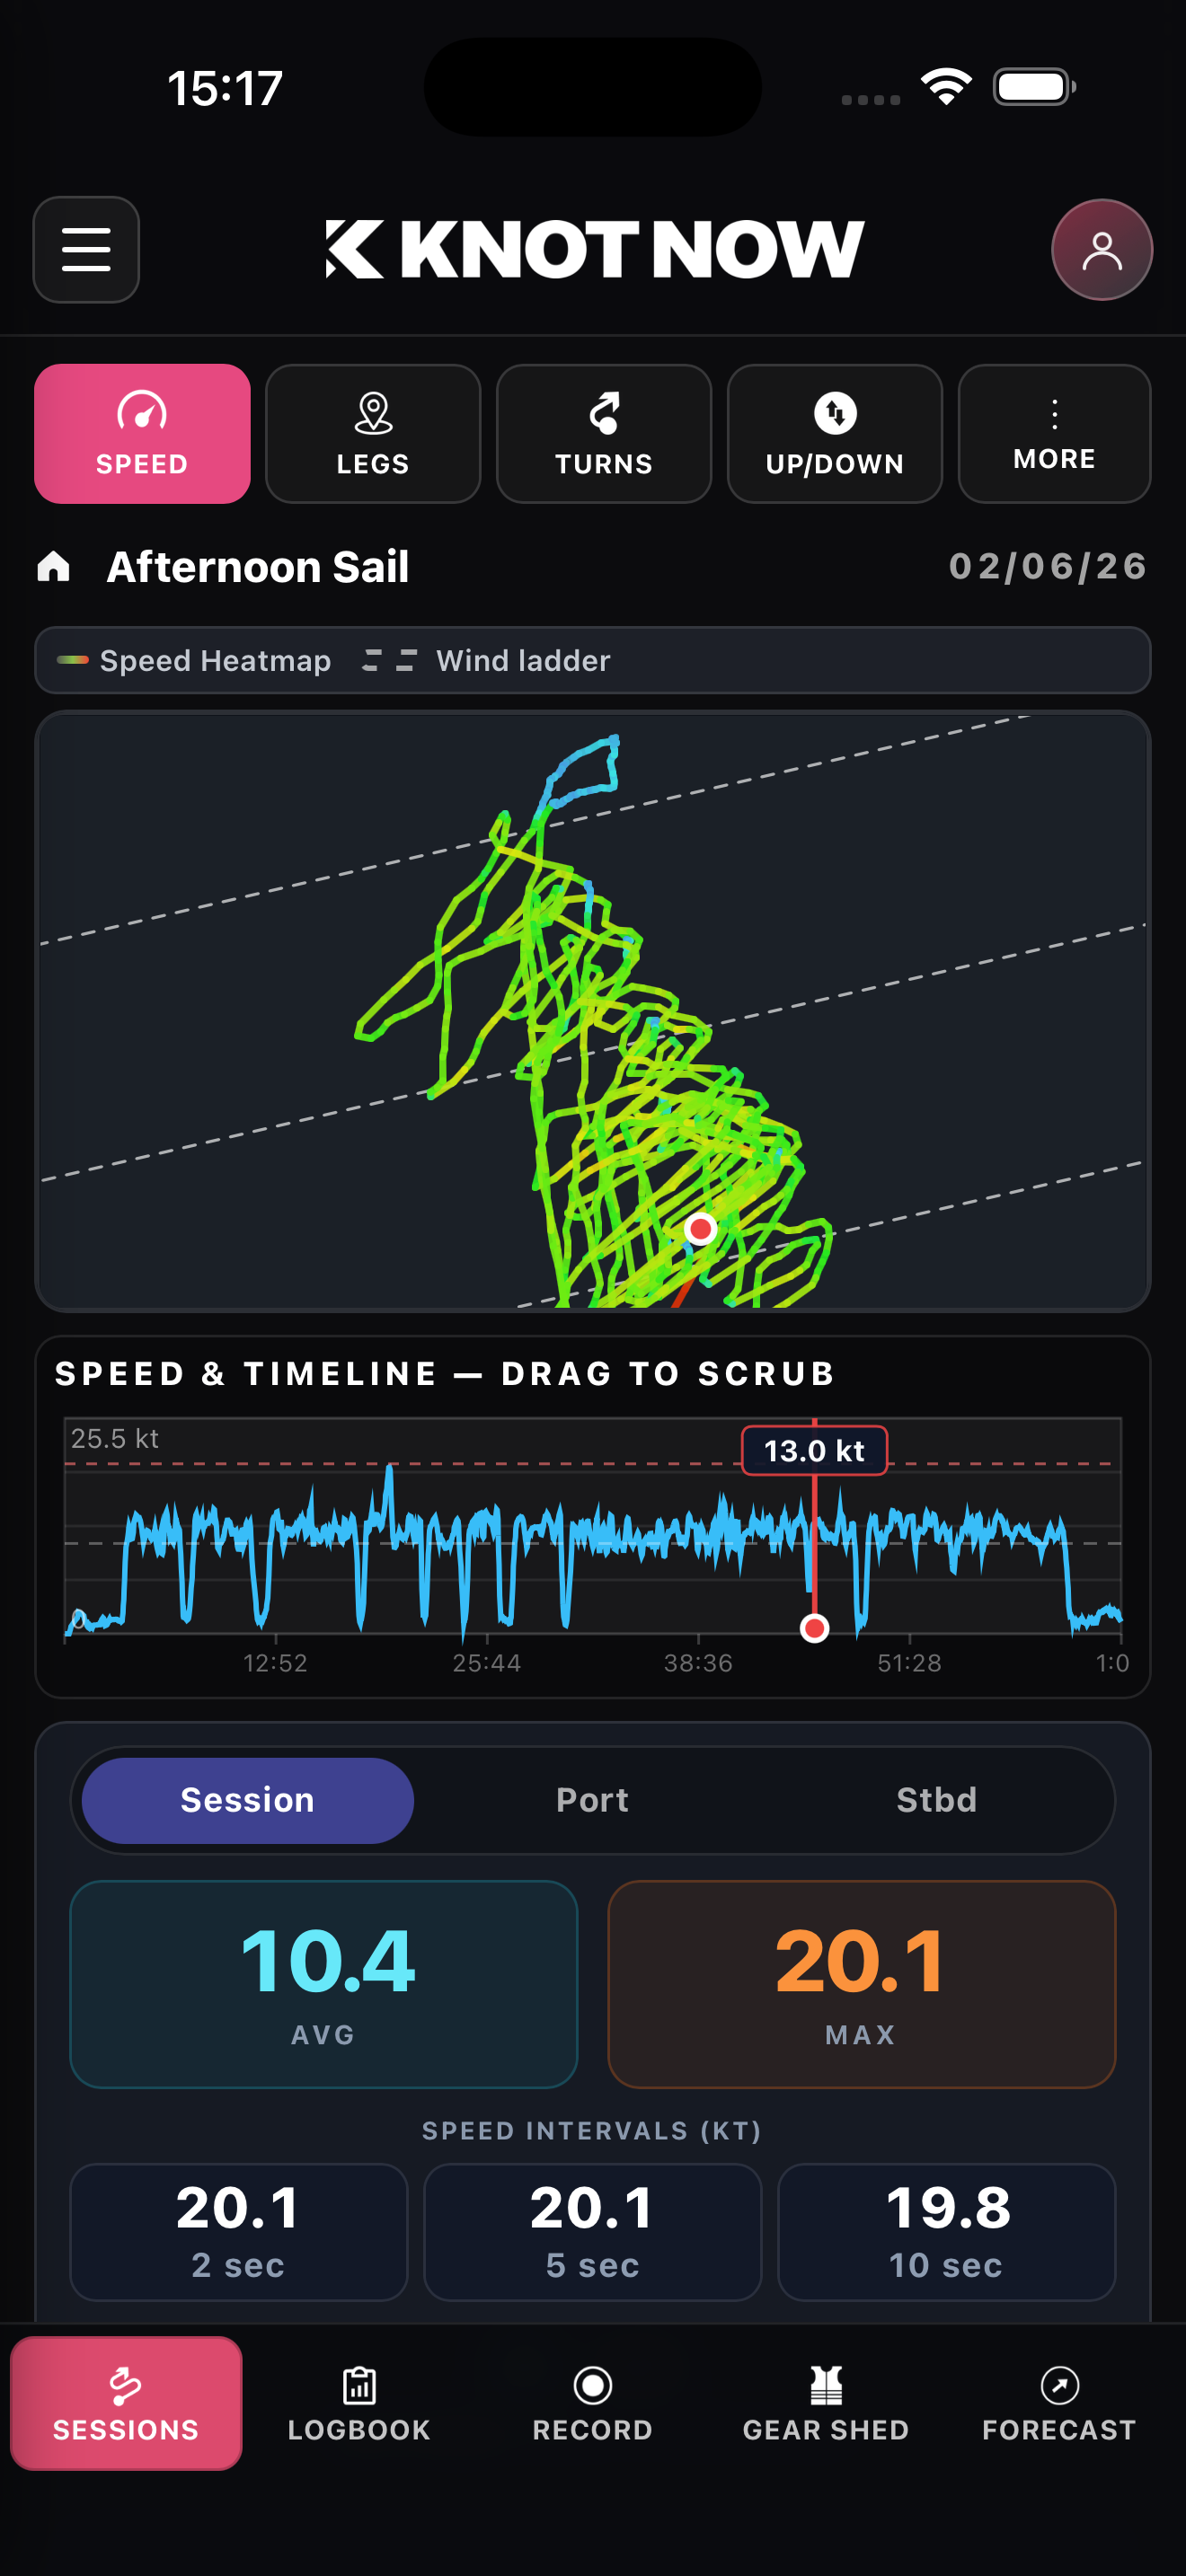
While our forecasting helps to see the crap (as well as the wind and tide), our deep-dive sailing analytics are what truly set us apart. KnotNow takes the precision of elite-level data and makes it accessible for everyone.
- Elite-level analytics & visualisation: Pretty awesome turn-by-turn tracking, super advanced speed metrics, and specific foiling stats viewed from every aspect.
- Performance tracking: Deep-dive into your upwind and downwind performance, charting your growth and tracking your data across time so you can clearly see your progression.
- Forecasts with a conscience: Hyper-local weather conditions tailored to your individual needs, seamlessly integrated with live sewage discharge data.
See you out there,
Rick
Questions or feedback? Get in touch.
On the App Store
Built for the water — forecasts & Sessions in one app
Free until 31st August. Download on iOS and explore UK forecasts, sewage alerts, and full session analytics.